Key Scientific Question
Can epitope contacts guide paratope formation before the paratope geometry is reliable?
Epitope-conditioned antibody design is not simply CDR loop generation. The generated CDRs must become an
antibody-like paratope whose contact pattern is compatible with a specified antigenic surface.
The core difficulty is temporal: many generators build cross-interface edges from the current provisional
CDR geometry. Antigen information is therefore used, but often only after the model has already proposed a
paratope hypothesis. REACH-Ab asks whether interface contacts can become active generative variables
earlier, while the paratope is still being formed.
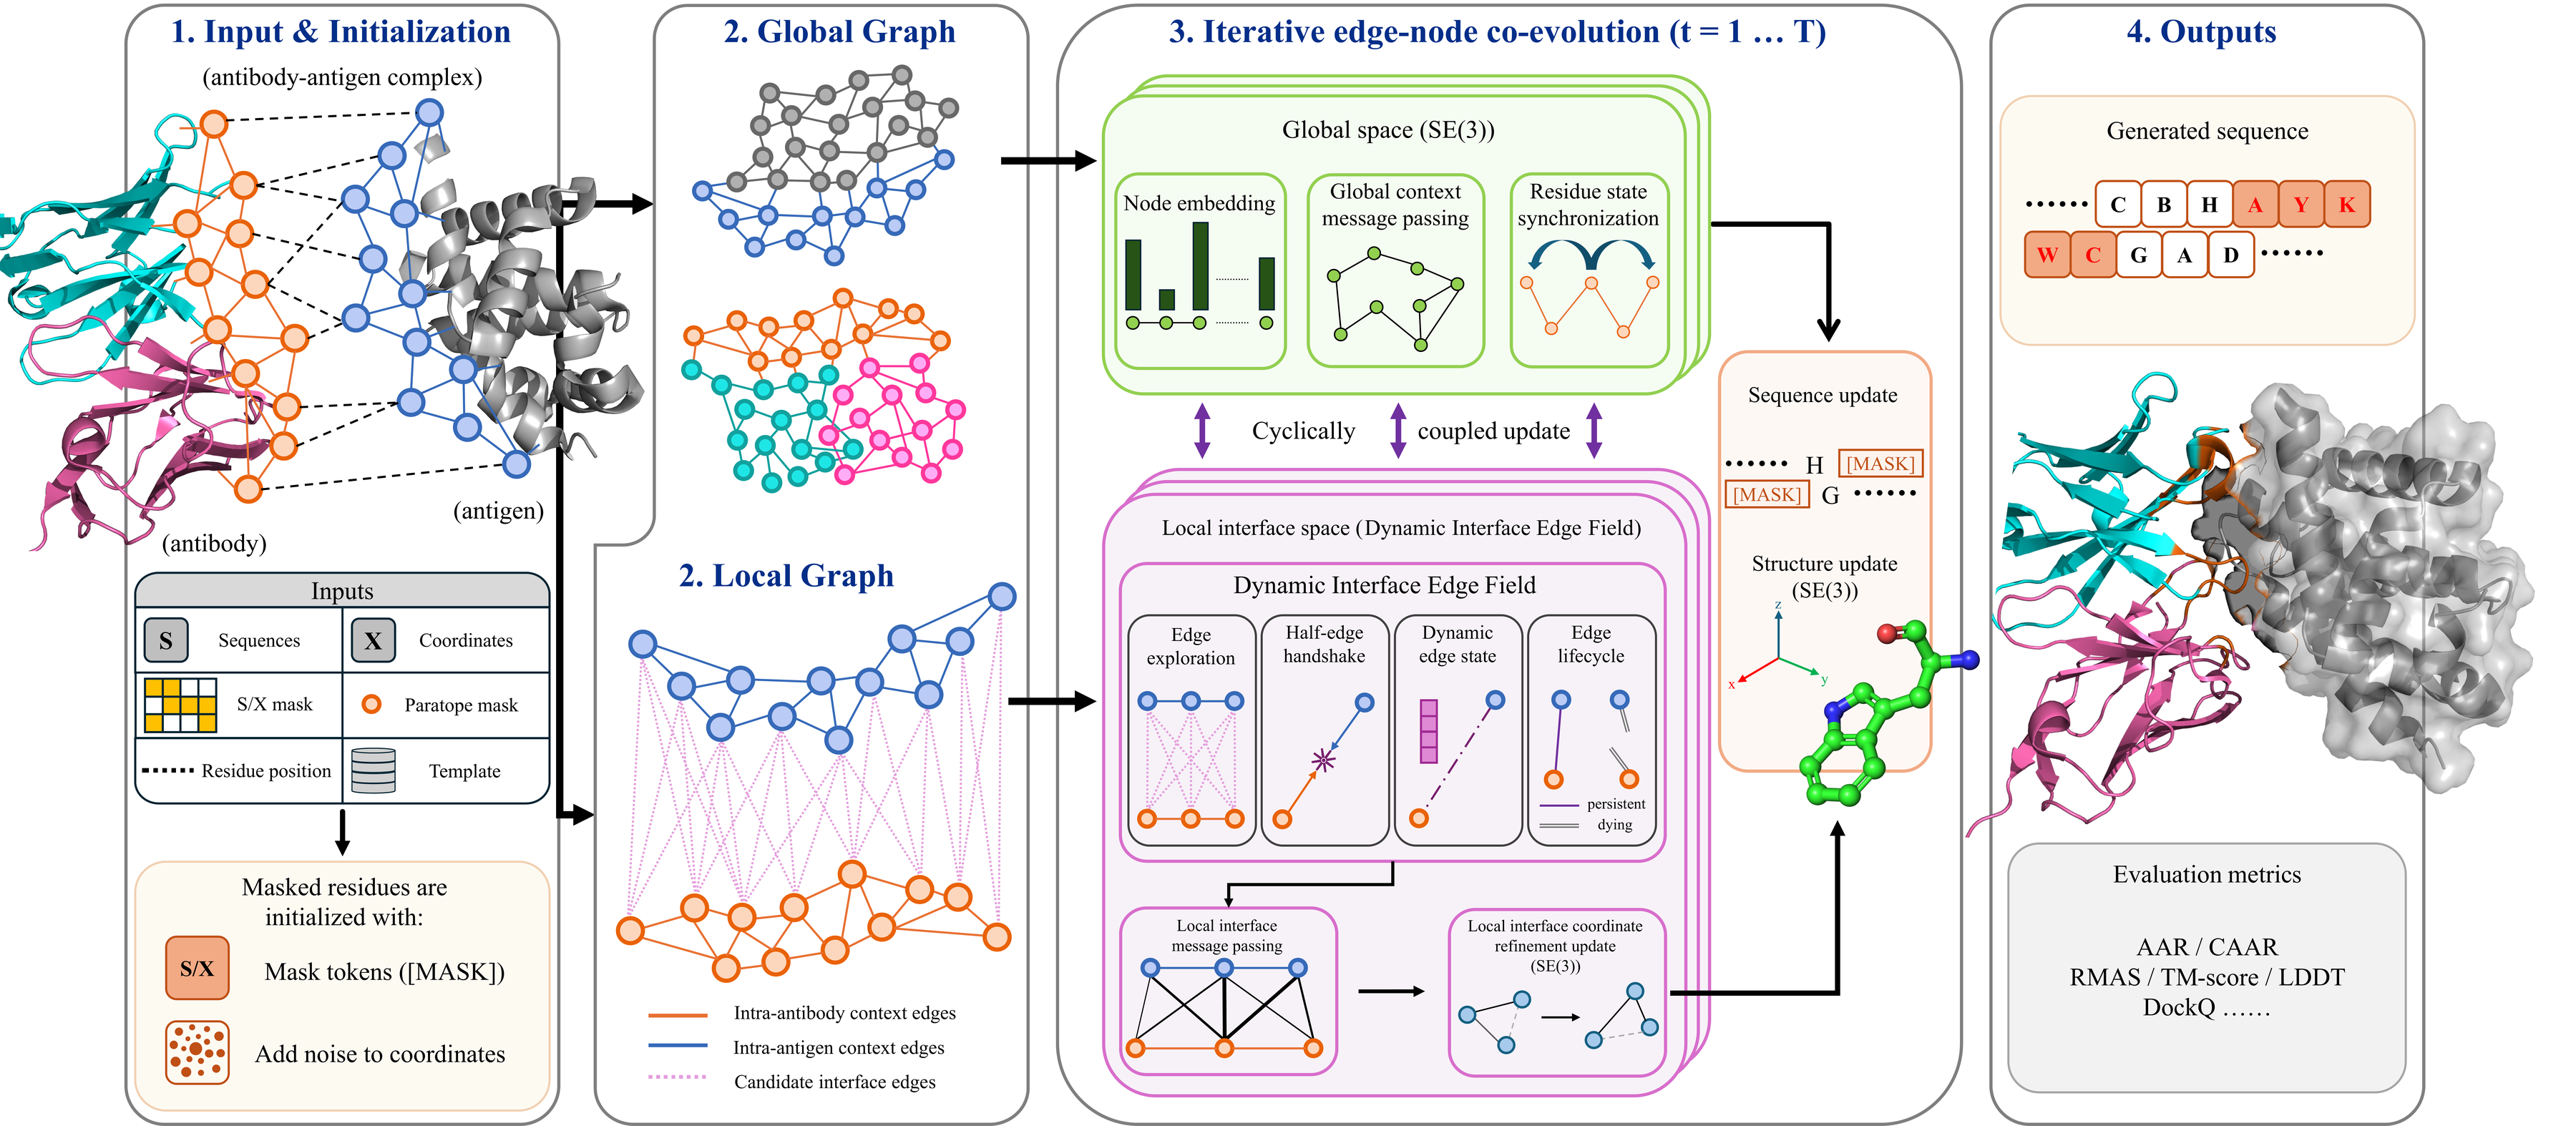
Core Innovation
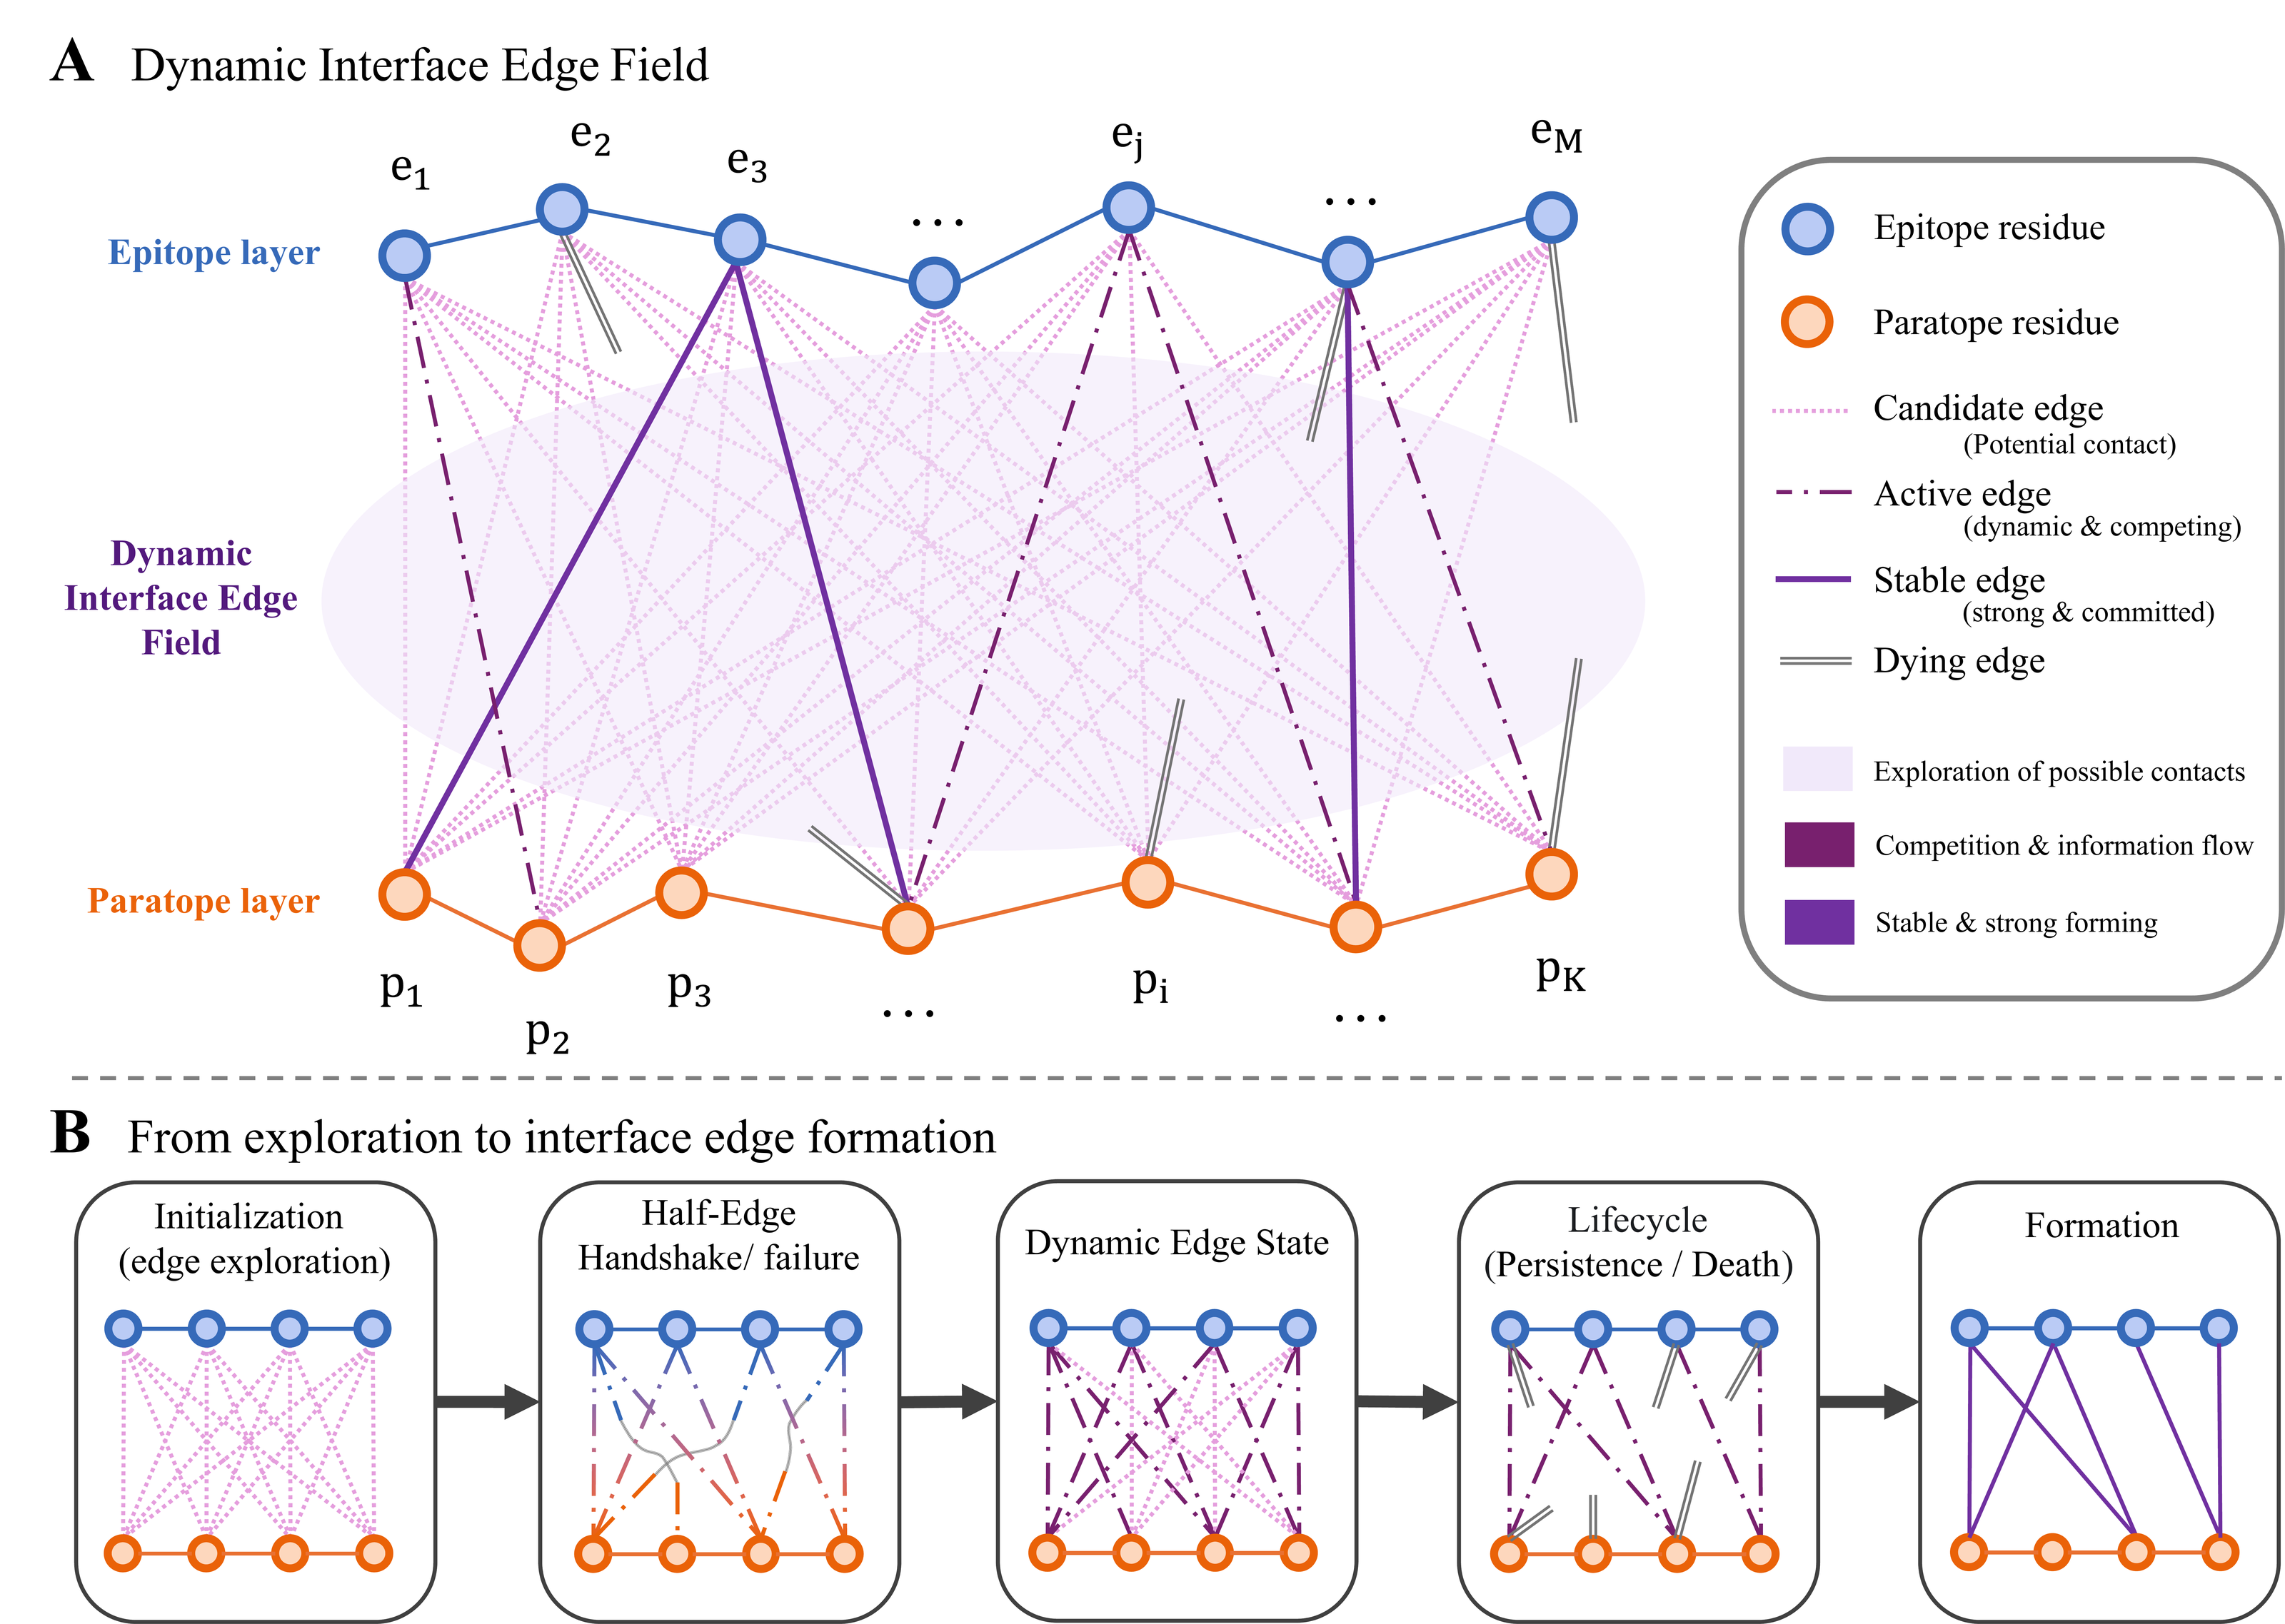
Dynamic Interface Edge Field
REACH-Ab treats cross-interface edges as learnable, evolving relation variables rather than passive kNN
or distance-threshold links. Candidate epitope-paratope relations can exist before the current geometry
makes them obvious, accumulate evidence across refinement rounds, and feed selected relation states back
into sequence and structure updates.
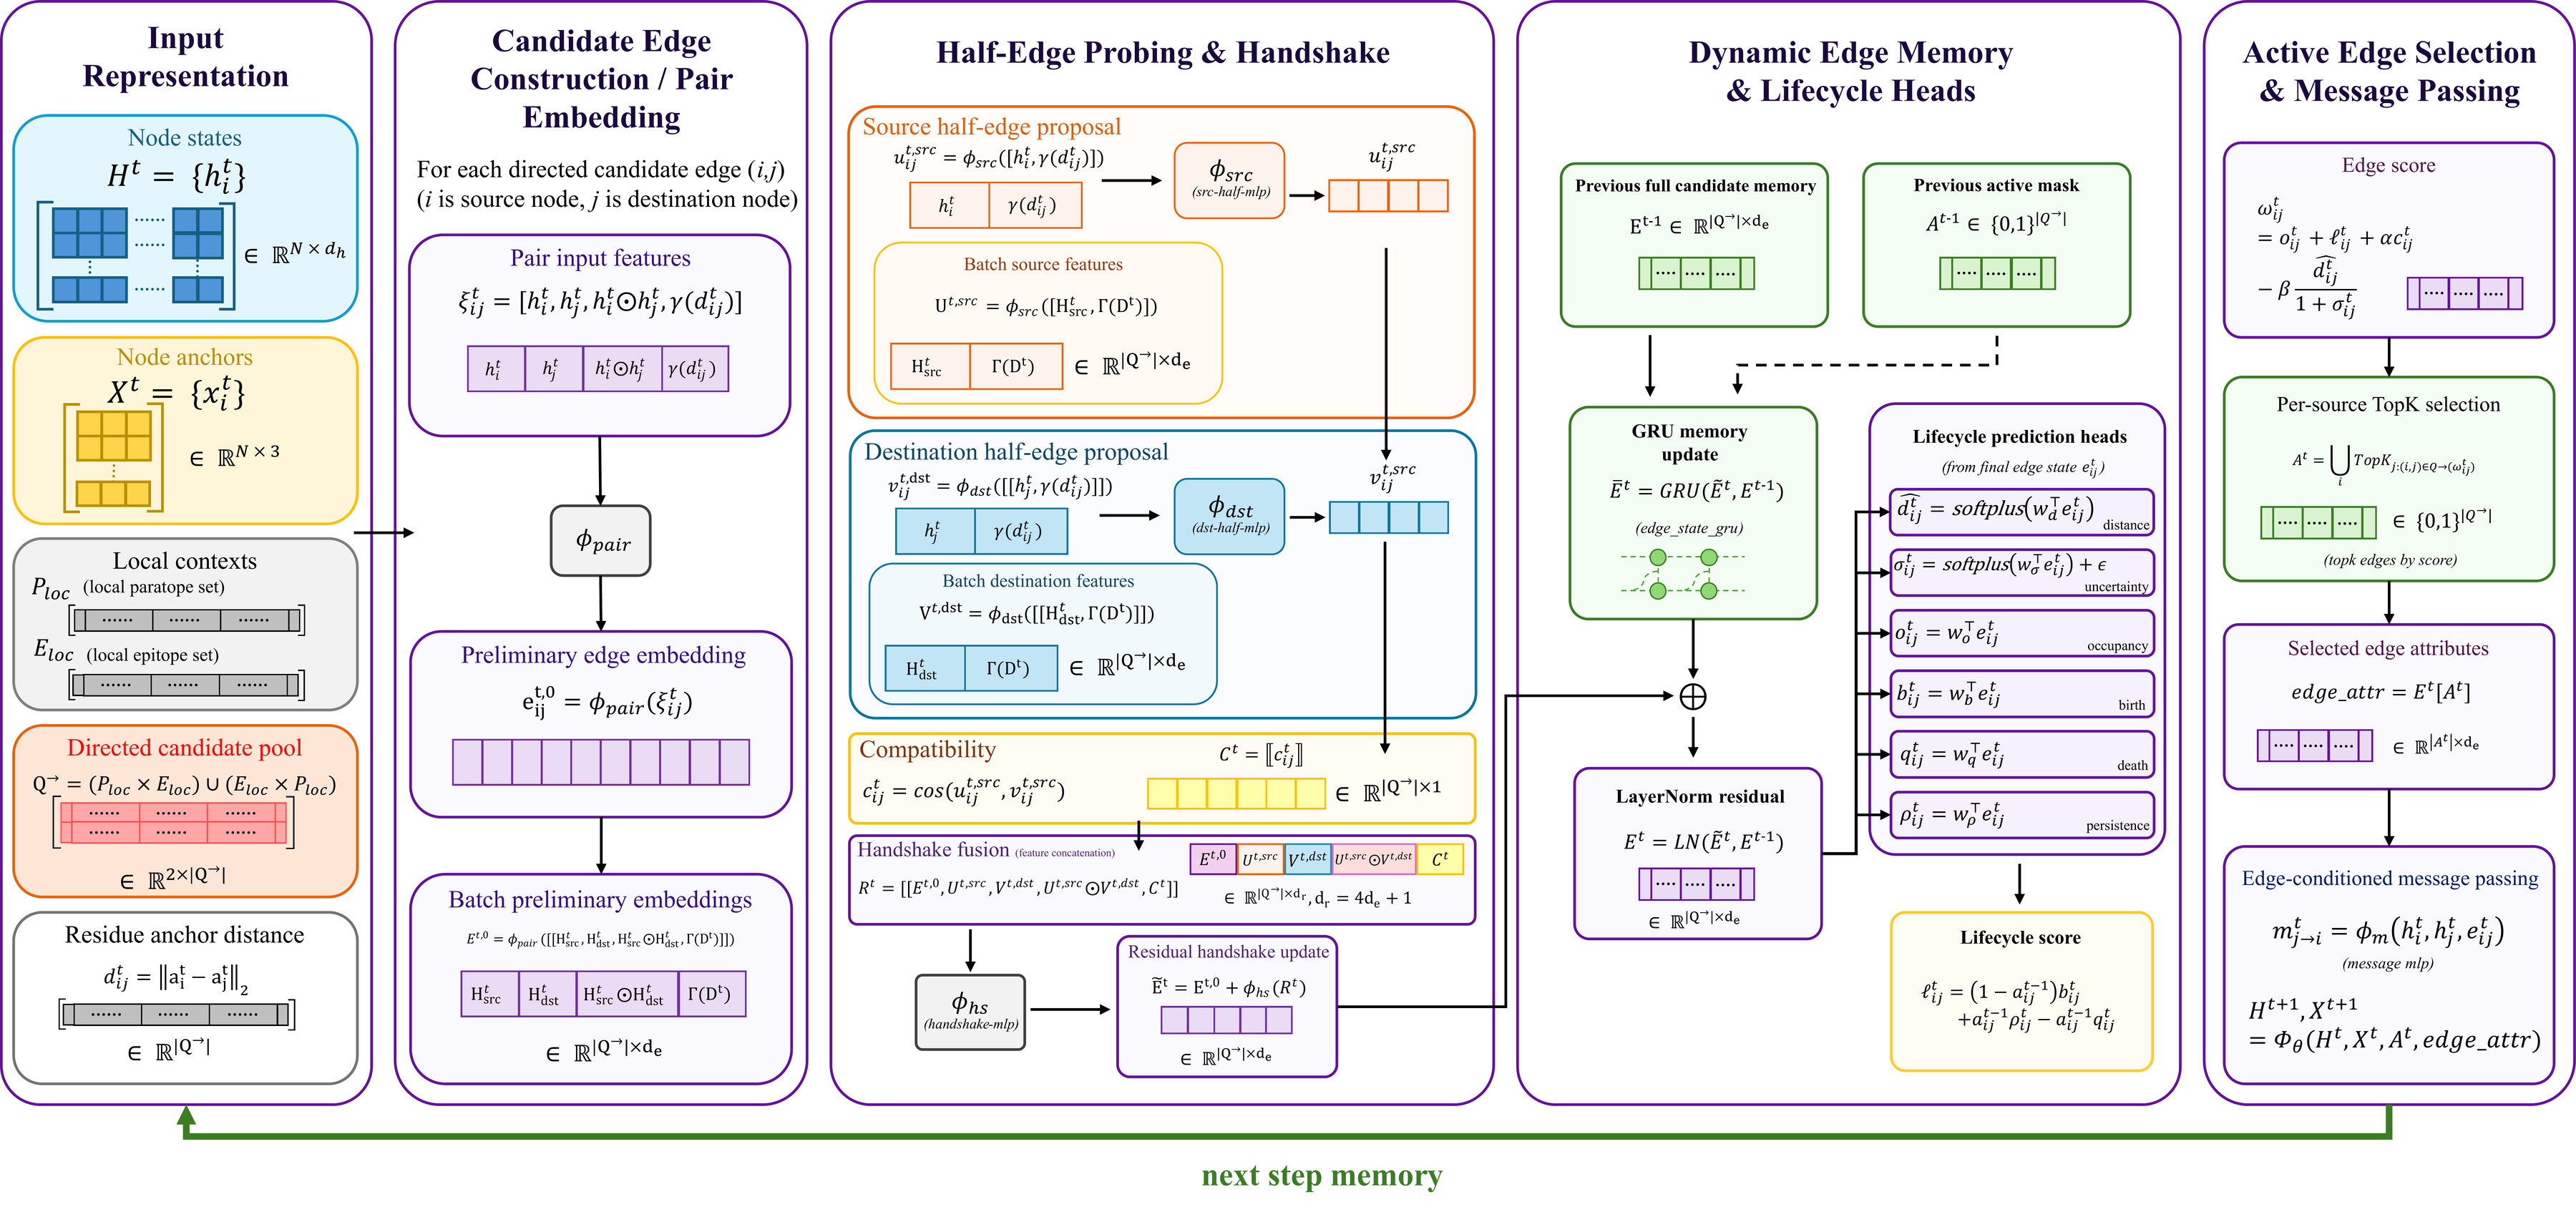
Half-edge handshake
Two interface sides propose compatible relation evidence.
Edge memory
Candidate relations keep history across generation steps.
Lifecycle scoring
Relations can be born, maintained, suppressed, or marked uncertain.